Avoiding paralysis by analysis 

When faced with a difficult decision to make, it is easy to get stuck by the big want for more information. How do you avoid analyzing everything you do not know, or maybe just as important, how do you avoid paying a consultant for doing stuff you don’t need?

IMG_0988

Start by taking a step back. You should check your priorities and needs for information as a first step. What do you need to know, and what would you like to know? If you are aiming for the latter you may be in danger of paralysis. When your view on the matter has become clear you can start the path to the decision by asking questions:

  • What do I already know?
  • What do I need to fill in?
  • Do I have the right competence available?
  • What is the most efficient way to get what I need?

By asking and answering these questions, you are in a much better position, even when you need to use consultants- because you know what to ask for.

Do you calculate failure probabilities during process design?

Process design often follows this pattern in practice:

  1. Draw up P&ID’s and add instrumentation, safety functions and alarms
  2. Perform HAZOP
  3. Change P&ID’s
  4. Perform SIL allocation study
  5. Wait….
  6. Calculate probabilities for failure on demand for safety functions with SIL requirements
  7. Realize this is not going to work
  8. Back to 3

Instead of doing this – which is very expensive – we should calculate the probability for failure on demand while designing the safety functions. This can be done in a number of ways, ranging from relatively coarse and simple to very involved and complex, like Petri nets and Monte Carlo simulations. For design evaluations, simple methods are usually good enough. The simplest of all may be the interpolation of pre-calculated results. Say someone compares a lot of architectures and failure rates and makes a gigantic table of PFD results for you – then you can just look it up. The good news is – somebody already did. You can find such tables in IEC 61508-6, Appendix B. This, we can of course use a spreadsheet to do, like in the example below – no fancy software needed in other words.

Say you have a safety function with a sensor element with λDU = 4 x 10⁻⁷, and a logic unit with λDU = 2 x 10⁻⁷ and your final elements with λDU = 2.6 x 10⁻⁷. You need to comply with a SIL 3 requirement. Using the lookup tables, we then quickly estimate that the PFD is approximately 1.03 x 10⁻³. This is quite close to SIL 3 performance but since there is some uncertainty in play and we know the final element is usually the problem (it also has the highest failure rate) we opt for a 1oo2 configuration of the final element. Then we obtain 4.7 x 10⁻⁴, which is well within a SIL 3 requirement. As a designer, you can do these type of estimates already at point 1) in the sequence above – and you will save yourself a lot of trouble, delays and costs due to changes later in your design project.

For a small fee of 20 USD you can download the spreadsheet used in this example, capable of performing many different PFD calculations for 1-year test intervals (including diagonistics, common cause failures and redundancies). Get it here: Spreadsheet for SIL Calculations.

When does production downtime equal lost production?

Running a large factory or an oil platform costs a lot of money. It costs a lot of money to build the thing, it costs a lot of money to run the thing. The only reason people build and run these things is that they get even more money in, than they have to spend on building and operating their assets. In this post we are going to look at the operating expenditure and loss related to downtime on oil production platforms. What is special about these platforms compared to other factories is that they are producing from a more or less fixed reservoir of resources, and when you have depleted the reservoir, the party is over. Production downtime is often included as a risk category in SIL allocation work – often hidden under a somewhat diffuse name such as “asset impact” or “financial loss”. An accident causes financial loss in many ways:

  • Lost market confidence
  • Lost contract opportunities
  • Direct production loss
  • Repair costs
  • Extra money needed for marketing and branding

In risk discussions we normally think about direct production loss and repair costs – the other things are not included. This is OK. We’ll put the repair costs aside for now, and look at three different views people tend to take when discussing production downtime.

  • Lost production is a complete loss of income
  • Lost production means simply that income will come at the end of the production horizon and there is no loss provided the oil price stays the same
  • Lost production will lead to a loss measured in present value depending on the oil price and the cost of capital

The first one is the easiest to use in assessments (3 days of downtime x 10 million dollars per day = 30 million dollars lost). The second one means that you do not care about downtime – and is not very realistic. Usually someone will convince the person claiming this that he or she is wrong. The last option is obviously the most “correct” but also the most difficult to use for anything in practice. Who can tell what the oil price is in 20 years? And in particular, which engineer can do this calculation in real time during a risk assessment discussion? These obvious difficulties often lead people to go with the “it’s all lost” option. Let’s have a look at what this really means for two different scenarios. The assumptions we make is that one day of production is worth 10 million dollars and that all operating expenses are fixed. We compare a production horizon of 5 years with a production horizon of 20 years. So we need to compare the value of 1 day of production now, in 5 years and in 20 years in terms of present value. Since we do not know the cost of capitcal for this particular operator we will calculate with a discount factor similar to what could be obtained by not trying to recover the production but rather investing the same amount of money in company stock. For simplicity we assume a 7% discount rate (it’s an arbitrary choice but not orders of magnitude away from what can be expected). The present value of 1 day of production in 5 years is thus:

5 years deferred production: 10 million / (1+0.07)5 = 7.1 million

20 years deferred production: 10 million / (1 + 0.07)20 = 2.6 million

We see that deferring production by 5 years at an opportunity cost of 7% per year we get a present value loss of 29%, whereas for deferring production for 20 years we lose 74%. For a 7% opportunity cost we can draw this graph for cost of deferred production in per cent of the current value:

This should not be a topic for discussion during a risk assessment workshop but should be baked into the risk acceptance criteria. For projects with long production horizons (say 15-20 years), a day of downtime may conservatively be assumed to be lost. For shorter durations the asset owner should define acceptable frequency of downtime, e.g.

1-3 days downtime: 0-10 years between

4-10 days downtime: 10 – 30 years between

..

This type of acceptance definition is more practical to use than a dollar value.

Uncertainty and effect of proof test intervals on failure probabilities of critical safety functions

When we want to make sure that the integrity of our safety function is good enough, we use a calculation of probability of failure on demand (PFD) to check against the required reliability level. The requirement comes from a risk analysis as seen up against risk acceptance criteria. But what are we actually calculating, and how do uncertainties and selection of safety intervals change the results?

Most probability calculations are done for the time-averaged value of the probability of failure on demand. Normally we assume that a proof test will discover all failure modes; that is, we are assuming that the test coverage of our proof test is 100%. This may be unrealistic, but for the time being, let us just assume that this is correct. The average PFD for a single component can be calculated as

PFDavg = λDU x τ / 2,

where λDU is the failure rate per hour and τ is the proof test interval in hours. Let us now consider what the instantaneous probability of failure on demand is; this value grows with time after a proof test, where it is assumed that the PFD is zero at time zero for 100% proof coverage. The standard model for component reliability follows an exponential distribution. This gives the probability density function for the exponential distribution:

PFD(t) = 1 – e-λt .

Effect of proof test interval and the time-variation of the PFD value

The instantaneous probability of a failure on demand can thus be plotted as a function of time. With no testing the failure probability approaches one as t → ∞. With the assumption of 100% proof test coverage, we “reset” the PFD to zero after each test. This gives a “sawtooth” graph. Let us plot the effect of proof testing, and see how the average is basically the probability “in the middle” of the saw-tooth graph. This means that towards the end of your test interval the probability of a failure is almost twice the average value, and in the beginning it is more or less zero.

In this example the failure rate is 10-5 failures per hour and the proof test interval is 23000 hours (a little more than two and a half year). By increasing the frequency of testing you can thus lower your average failure probability, but in practice you may also introduce new errors. Remember that about half al all accidents are down to human errors – several of those during maintenance and testing!

Effect of uncertainty in failure rate data on calculated PFD values

Now to the second question – what about uncertainty in data? For a single component the effect is rather predictable. Let us use the same example as above but we want to investigate what the effect of uncertainty on λ is. Let us say we know the failure rate is between 0.70 and 1.3 times the assumed value of 10-5. Calculating the same saw-tooth function then gives us this picture:

We can see that the difference is quite remarkable, just for a single component. Getting good data is thus very important for a PFD calculation to be meaningful. The average value for the low PFD estimate is 0.08, whereas for the high PFD estimate it is 0.15 – almost twice as high!

Let us now consider what happens to the uncertainty when we combine two components in series as in this reliability block diagram:

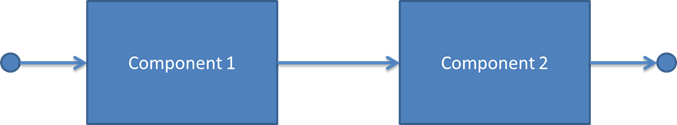
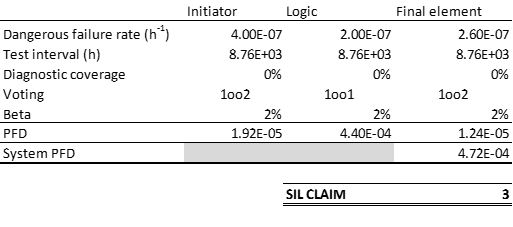
These two components are assumed to be of identical failure rates and with the same uncertainty in the failure rate as above. If both have failure rates at the lower end of the spectrum, we get an overall PFD of PFD1+PFD2 = 0.16. If, on the other hand, we look at the most conservative result, we end up with 0.30. The uncertainties add up with more components – hence, using optimistic data may cause non-conservative results for serial connections with many components. Now if we turn to redundant structures, how do uncertainties combine? Let us consider a 1oo2 voting of two identical components.

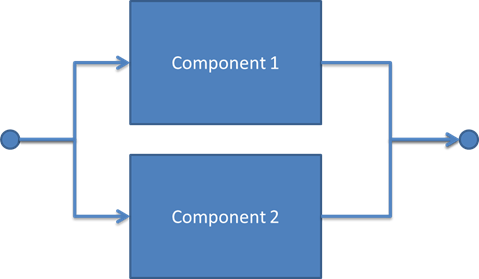
The PFD for this configuration may be written as follows:

In this expression, which is taken from the PDS method handbook, the first part describes the PFD contribution from a common cause failure in both components (such as defects from production, clogged measurement lines on same mount point, etc.), whereas the second part describes simultaneous but independent failures in both components. The low failure rate value gives a PFD = 0.10, the high failure rate gives PFD = 0.20 and the average becomes 0.15. In both cases the relative uncertainty in the PFD is the same as the relative uncertainty in the λ value – this is because the calculations only involve linear combinations of the failure rate – for more complex structures the uncertainty propagation will be different.

What to do about data

This shows that the confidence you put in your probability calculations come down to the confidence you can have in your data. Therefore, one should not believe reliability data claims without good backup on where the numbers are coming from. If you do not have very reliable data, it is a good idea to perform sensitivity analysis to check the effect on the overall system.


Do you consider security when purchasing control system equipment?

SCADA security has lately received lots of attention, both in mainstream media and within the security community. There are good reasons for this, as an increasing number of manufacturing and energy companies are seeing information security threats becoming more important. SANS recently issued a whitepaper on industrial control systems and security based on a survey among professionals on all continents. The whitepaper contains many interesting results from the survey. These are three of the most interesting findings:

  • 15% of respondents who had identified security breaches found that current contractors, consultants or suppliers were responsible for the breach
  • Only 35% of respondents actively include security requirements in their purchasing process
  • The number of breaches in industrial control systems seem to be increasing (9% of respondents had identified such breaches in the 2014 survey vs. 17% in the 2015 survey)

That external parties with legitimate access to the SCADA networks are sources in many actual breaches is not very surprising. These parties are normally outside the asset owner’s management control, and they may have very different policies, awareness and protections available at their end. One notable example from a while back where this was the case in a much publicized data breach was the Target fraud in 2014. In that case, the attack vector came via a phishing e-mail sent to representatives for one of Target’s HVAC vendors. The vendor connected to Target’s IT network over a VPN tunnel, unknowingly transporting the malware to the network. The advanced attack managed to siphon away credit card data from millions of customers, uploading it to an FTP server located in Russia. Media has described this attack in detail and from many angles and it is an interesting case study on advanced persistent threats.

This is obviously a cause of concern; how do you protect yourself against attack vectors using your vendors as point of entry? Of course, managing credentials and only giving access to systems the vendor should have access to is a good starting point. But what can you do to influence whaty they do on “the other side” of the contract interface?

First of all – security awareness training should not only be for engineers and operators. The same type of awareness training and understanding of the business risk related to cyber attacks should be provided to your purchasers. From reliability engineering we have long seen that obtaining items that comply with requirements can be challenging; if the requirements are not even articulated, no compliance can be expected. Including security requirements in purchasing and contracts should be an important priority. It is probably a good idea to include this in your company’s security policy.

The next obvious question is maybe “what kind of requirements should I put forward to the vendor”? This depends on your situation and the risk to your assets, but it should include both technology requirements, after-sales updating and service requirements, security practices, and awareness requirements for companies providing services. If your HVAC vendor has low security awareness, it is more likely that he or she will fall for a phishing attempt – putting your control system assets at risk. Due diligence should thus include cyber security requirements; it is really no different from other quality and risk management controls that we normally integrate into our purchasing processes.

Progressing from design to operation with a SIL rated system

Many companies operating industrial production systems have learned how to use risk assessments and safety integrity levels during design and process development. Many have however asked how do we actually work with this in operations to make sure the safety functions actually provide the level of safety we need. Maintaining the safety ingrity level throughout the operational part of the asset’s lifecycle can actually be very demanding, and it requires a holistic view of asset management considering many aspects. A good asset management program needs to make sure design requirements are fulfilled; it needs to have provisions for monitoring the state of the asset for damage or degradation such as corrosion, instrument drift or material defects. It must also prioritize such that maintenance is effective and does not drive costs in unhealthy ways. Asset management and barrier integrity management is thus no easy task.

When taking a system from design to operation we are equipped with theoretical foundations and plans for how to use the asset. We do not have operational experience, and we do not know how the asset actually will perform in practice. We need to take what we have learned during engineering and transform this into a system for managing our assets in a way that includes barrier integrity, and that takes the requirements and limitations of SIL rated systems into practice. Necessary functions and considerations for establishing a good barrier management system are shown in the figure below. You should include planning for operations already when establishing the functional safety management plan in the design phase.

We need to take with us the safety requirements from engineering into the barrier management system. For your safety instrumented system this would consist of information found in the Safety Requirement Specification (SRS) and the risk assessments used to establish the SRS. The reason for the latter is that we need to make sure that the assumptions about other independent protection layers are not violated, or that protection layers do not disappear. Further, your company needs to have performance standards for different systems – these should also be integrated into your barrier management system. Finally, from a practical and economical point of view, you need to take your maintenance and spare parts philosophy to the next level by implementing the necessary maintenance activities for barrier elements in your barrier management system.

Monitoring for safety is very important if you want your risk management system to work. For SIL rated systems there are many sources of performance data. These should at least include results from proof testing, from diagnostics and automated monitoring systems, and from maintenance focused inspections. All of these data should be analyzed using suitable tools, and the results of this analysis should be taken into your overall barrier management data storage or data warehouse. Based on the data gathered and the state of the barrier system, you need to device actions and make sure they are done in due time to avoid deterioration of the system.

Is security management still following the «whack-a-mole» philosophy of yesteryear?

Anyone following current news can see that cyber security is an increasing problem for society, from private individuals to government institutions to small and large corporations. Traditional defense of information assets has followed a simplistic perimeter defense sort of thinking, with an incident response team in addition responsible for finding and fixing problems after they have occurred. Modern thinking in security emerging over the last decade has largely left this approach to security because it is very inefficient for protecting our information assets. The current term used for a more holistic view on security management is often referred to as “cyber intelligence”, such as this article at Darkreading.com. Modern thinking around this has emerged by combining developments in software security, criminology, military counter-insurgency tactics and risk management. This change was summed up nicely at the last RSA security summit with one sentence;

There is no perimeter.

The meaning of this is that setting up a defense consisting of firewalls and anti-virus protection is a good thing to do – but by no means is it a solution to all problems; even with these kind of technologies present, breaches are inevitable. Still, many organizations still follow the whack-a-mole-thinking:

  • Invest in antivirus and firewall tools
  • Buy an intrusion detection system
  • If a breach is discovered, disconnect the computer from the network and re-image it to cleanse
Photo: TPapi under Creative Commons license (https://creativecommons.org/licenses/by-nc-sa/2.0/)

There are many reasons why this does not work. Here are three of them; viruses today often mutate from on infection to the next, making signature based AV more or less useless for advanced malware, and most attacks live on the network for extended time before delivering a payload, basically invisible from both users and automated network tools for intrusion detection. Finally, there are always people with legitimate access to the information assets who can be influenced to initiate an attack – knowingly or not (typically this is referred to as social engineering). Basically – you don’t know what hits you before it’s too late.

The worst thing is probably that there is no direct cure. The good news is that you can make your systems much harder targets through good risk management and defense strategies that can help you cope with the threat in a much better way. Following basic risk management thinking can get you a long way by identifying potential weaknesses, threats and vulnerabilities in all parts of your information system lifecycle is the starting point. This means even during development (if it is your software/hardware) or procurement – you need to assess the dangers and find mitigation plans. A mitigation plan should not be simply reactive (whack-the-mole) but rather proactive, such as “how can we minimize the risk such that we think it is acceptable taking both probabilities and consequences into account”? In order to have an informed opinion on this, you need to determine not only what the potential impact of an attack could be, but also the credibility of such an attack. In order to do that, you need to review who the attackers are, how is the outside world affecting the situation, what are the attackers motivations, what are their capabilities, is there a cost-benefit trade-off, and so on. It is from this view the term “cyber intelligence” comes. Having such information at hand, together with a lifecycle oriented mitigation plan, puts you in place to build a resilient organization that is not played out on the sideline easily by the bad guys.

Your safety and human factors

Today I almost lost a wheel on my car while driving. How could this happen? This morning I went to the dealership to change tires on my car. I had to wait for the mechanic to come in to work in the morning because I was a bit early, and I didn’t really have an appointment, I just showed up. After a while the mechanic arrived and after some 15 minutes they gave me my keys back and told me “you’re good to go”. Happily I drove down to the office with new tires on the car.

bilmann

 A little later today I was going to see one of our clients, and I started driving. After a few kilometers I started to hear a banging noise from the back of my car. This had happened to me once before, several years back, but I immediately understood that one of the wheels had not been properly fastened and that I should stop right away. I pulled over and walked around the car – and yes, the bolts were loose – actually they were almost falling out by themselves! Obviously this was very dangerous, and I called the dealership and told them to come and finish the job on the roadside. They actually showed up after just a few minutes, and the guy coming over appoligized and tightened all the bolts. I suggested to him that they should consider having a second person check the work of the mechanic before handing the vehicle back to the owner. He agreed – and told me it was “the new guy” who’d changed the tires in the morning.

This was down to several factors – a new guy, maybe with insufficient training, and a client putting pressure on him to finish the job (I was inside the dealership drinking coffee – didn’t talk to the mechanic, but it may have been interpreted this way by him). Simple things affect our performance and can have grave consequences. Why did it not go wrong this time? Because I recognized the sound, I stopped in time before the wheel fell off – it was just luck in addition to experience with the same kind of problem. Humans can thus both be the initiating causes of accidents, and they can be barriers against accident.

The problem is not with your brain, Sir, it is the number of limbs

Functional safety design is a concurrent activity with process design. In a process plant, the process engineer will specify the safety functions for a given unit. Take for example a pressure vessel with several inlets, such as a typical second-stage separator in an oil-production train. This is a pressure vessel separating oil and gas by gravity, and typically the number of inlets is quite high. This is because the main production stream enters this separator, together with recovered oil from multiple units downstream the separation train, for example compression train scrubbers, an electrostatic coalesce, reclaimed oil sump from the flare knock-out drum, etc. A simplified drawing of this may look as follows:

This pressure vessel is equipped with an automatic safety trip – a level alarm high high (PAHH). When the high high level is reached, the process shutdown system (PSD) will automatically stop inflow to the tank to avoid the level from increasing any further. Let us say this function has to satisfy a SIL 2 requirement, and that we have the following data available for the process shutdown valves (shown on the drawing), for the PSD logic node including I/O cards, and for the level transmitter:

Equipment type

Failure rate (Dangerous undetected failures per million hours)

Valve with actuator

0.5

Solenoid

0.3

Safety PLC with I/O cards

0.2

Level transmitter

0.3

(These data are made up for this example – use real data in real applications)

The formula for calculating the average probability of failure on demand for a function with no redundancy is PFD = λDU x τ / 2, where λDU is the failure rate for dangerous undetected failures per hour, and τ is the proof test interval between each time the function is fully tested. If we assume that we test this function once per year, we can calculate the overall PFD:

PFD = [PFDValve + PFDSolenoid ] x NValves + PFDPLC + PFDTransmitter

If we calculate this with the above data and 5 critical valves we get a PFD of 0.02. For a SIL 2 function we have to get below 0.01 – so this function is not reliable enough. Which options do we have, and what would be the best way to deal with this?

  1. Buy more reliable components?
  2. Redesign the process?
  3. Introduce other risk reduction systems to reduce the SIL requirement?

All of these changes could be useful – alone or together. However, it is a general problem that we get too many final elements in safety trips – and valves are typically much less reliable than electrical components. Therefore, it makes sense to reduce the number of valves. Actual valves can be more reliable than this – but they may also be less reliable. Considering reliability requirements when buying the valve thus is essential. In our case, we can look more closely at the system we are trying to protect;

  • Is the MEG injection really a big contributor? Maybe this line is normally not used, and the line size is very small? In that case we may choose not to include that valve in the SIL loop – although we will actually close it. But it is not critical to the safety of the system.
  • Can we combine some of the feed flows into a header – and locate one shutdown valve on that header instead of having individual valves? All flows are carrying oil – there is no reason to expect chemical incompatibilities. Let us say we confer with the process engineers and they agree on this.

We then have a changed process (we used option b).

With this changed design – what is the PFD now? We can recalculate with only 2 critical valves and end up with PFD = 0.009. This is below 0.01 and is acceptable for a SIL 2 application.

Points to remember

  • Be careful to avoid too many final elements in a safety function
  • Always make sure you buy equipment with the required reliability and sufficient documentation
  • When you need to change something – consider several options to avoid sub-optimizing your design

Treat your people well if you want your safety systems to work

Reliability standards all state requirements to planning and managing the functional safety work throughout the lifecycle. There are good and bad ways of doing this, and there is room for interpretation of the requirements in the standard. I’ve previously suggested 4 golden practices for good functional safety management – based on experience with what does not work in complex project organizations in different real-world offshore projects. This time we turn to another important aspect of maintaining focus, drive and high quality in all types of projects. That is how to plan and run a project with the well being of the project members and stakeholders during the process in mind.

“Making a small mistake due to stress and overload can have severe consequences when you are designing a barrier system.”

All resource constrained projects are running the risk of sliding into organizational overload. Overload is when individuals and organizations are fully saturated with workload; a situation where additional stress cannot be handled without decreasing performance. For an individual or organization in overload state, dysfunctional behaviors and dramatically reduced productivity can be expected. Four important factors related to perceived stress levels are competence, comfort, confidence and control. If these “4 C’s” are disrupted, stress increases rapidly and the organization or individual may go into a state of overload. There are many contributors to perceived stress levels for individuals; some of them may be called baseline factors such as type of organization and the organizational culture. Factors typically affecting individual stress levels within a project group are:

•    Scope creep without adequate resource allocation – leading to unrealistically high workloads

•    Need to apply technologies not understood by team members, and without appropriate training

•    Inadequate sponsor and management support

•    Lack of change management capabilities within project team

•    Management pushing for high-risk project without being willing to accept potential failures.

So, how would an overload situation affect the outcomes of SIL work? Would the system be passed through to operations with insufficient quality, or would lower quality products be caught in one or several verification acitivites and be rectified before the system is put to operation? Both scenarios are quite likely to occur. If overload occurs in early phases of the project, it is likely that errors would sneak into the requirement setting phase. There are fewer formal checks on the requirements themselves than on the implementation. The most likely verification activity to catch an error in the requirement phase would be during the functional safety assessment (FSA). It is recommended to have one FSA just after the requirement phase, but many projects skip this and wait until further into the SIS development part of the lifecycle. Discovering errors in requirements late in the project would have significant schedule and cost impact. Worse yet, finding errors in the requirements phase is much more difficult than finding implementation errors later. In software development, it is well-known that about 40-50% of bugs originate from errors in specification. Without specific verification activities on the requirement setting, this is likely to be even worse. For an interesting discussion on software bugs and specifications, see this old blog post from Tyner Blain; http://tynerblain.com/blog/2006/01/22/where-bugs-come-from/. One type of error would be to include protection layers that are not really dependable into the risk assessment, generating a lower SIL requirement than necessary. Another error would be to overlook identified hazards, such that there are “holes in the safety net” and effectively zero integrity for that type of scenario. Consequences of organizational overload can thus be severe in a project related to functional safety.

Strategies to counter risk of overload within a project are related to active management and control, both on the people level, as well as on measures of progress and cost control. Practices that are known to reduce likelihood of overload conditions on individual or group levels are:

•    Make few changes, and carefully mange changes when they are necessary

•    Check time constraints and resource allocation – management should not assign unrealistic time constraints on tasks. Most project management frameworks include the notion of “slack planning” to incorporate this task related schedule risk

•    Keep sustaining sponsors actively involved. Lack of interest from senior sponsors is very visible to project members and may hurt the energy levels available to perform at the expected level

•    Improve change capacity by managing talent within the project actively; this includes training, offering career possibilities when project nears delivery as well as succession planning for key roles.

From these bullet points, that are taken from PMI recommendations for handling overload risk, we conclude that taking care of your people is essential for good functional safety. Good competence management is a key to achieving this; lack of confidence in abilities is one of the most common stressors in projects where there is also a high degree of time pressure. Allocating resources such that there are not enough manhours available is just adding fuel to the fire. I have previously referred to this as “stupid resource planning“, and unfortunatley this is quite common, especially when there are schedule slips in projects.

To sum it up – make sure your people are not exposed to negative stressors over time. Maintain a positive attitude as a project manager – you are the leader of your people working on the project. In that respect – the most important thing of all is – “catch your people doing something right” – give praise whenever it is deserved. That takes the edge off of people and motivates them – the best cure there is against negative stress.